

Outlook 2026
Intersections in the House of Faust

By: Jonathan V. Bever
Managing Director/Financial Advisor
Bellevue Wealth Advisors
This article explores historical economic patterns and policy responses for educational purposes and does not attempt to predict market outcomes.
I have argued in prior blogs that money printing by the Federal Reserve, called Quantitative Easing, which is accomplished by increasing its balance sheet (QE), is a Faustian Bargain. In literature, Dr. Faust is an interesting character known for making a deal with the devil. Not too surprising, it did not turn out the way he expected.
The phrase Faustian Bargain:
“Fustian bargains are by their nature tragic or self-defeating for the person who makes them, because what is surrendered is ultimately far more valuable than what is obtained, whether or not the bargainer appreciates that fact.” Britanica
This blog has come out later than usual because I have had the pleasure of setting up a new office, Bellevue Wealth Advisors. I am pleased to post my first blog post under this name. This is an ambitious blog that covers a lot of ground, primarily by exploring parallels with the 1960s and 1970s. Grab your favorite beverage and enjoy the journey.
Return Forecast 2026
The S&P 500 has an earnings growth forecast of 11.28% and a dividend of 1.14% according to Bloomberg estimates. Let us add them together, and we could get a simple forecast for 2026 of 12.42%. However, there are possible headwinds this year, such as lower earnings as high oil prices cut into profits. Further, if uncertainly remains elevated, then we could see a lower price-to-earnings ratio on the S&P 500. I might expect a modest return of 6%. However, it looks like the Fed is increasing its balance sheet. Please see the chart below, which illustrates the historical S&P 500 return and the Fed balance sheet. You can see the Fed's balance sheet has been slowly increasing recently.
 Chart: by Jonathan Bever. Data: Bloomberg
If the Fed cuts rates aggressively and continues Quantitative Easing, then market may go up more than expected. I believe the Fed will likely be more focused on inflation and would rather not cut rates or expand its balance sheet too much. If the Fed lowers its rate aggressively and expands its balance sheet, it could possibly drive the market up at the cost of increased inflation. Eventually, it will have to address inflation again. The cure for high prices is high prices. My suggestion is to find total-return strategies that can keep up with inflation while remaining diversified.
Intersections
When driving, the prudent thing to do at an intersection is to slow down. Road signs indicate or require what the prudent driver should do. In the abstract world of economic cycles, we don’t get signs flashing telling us what to do. Rather, we get hints if we pay attention. I believe we are heading into a period like the 1970s, but I do not know for sure. I think we will encounter many intersections, and we will have to see which way they will go, such as the price of oil, short-term interest rates set by the Fed, intermediate and longer-term interest rates set by the market, the P/E multiple on the S&P 500, inflation as measured by the Consumer Price Index (CPI), etc. As we approach these intersections, I suggest we slow down because we do not know which way they will go. Nonetheless, I have conviction that longer-term trends to be higher interest rates along the yield curve from the short term all the way to the longest term; further higher inflation as measured by the CPI, and a lower P/E ratio on the S&P 500,
We Have Been Here Before: Lessons we can learn from looking at the 1960s and 1970s, Part II
When referring to the 1970s, I mention stagflation, and today there is concern that we will experience stagflation like that era.
In my last blog regarding my outlook for 2025, I suggested we might be heading back to a period like the 1960s and 1970s in the US. During the 60s/70s, our country's GDP was robust; it was a strong economic period following the baby boom. Yet, there was a recession every 5 years. There were 4 recessions. Boom and bust- gloom then doom. A robust GDP of around 5 percent was not uncommon, and inflation, as measured by the consumer price index, was similarly robust. CPI inflation averaged 3 percent in the 1960s and double-digit in the 1970s. All those babies grew up and demanded more stuff! Further, with full-blown inflation, we left the gold standard, experienced an oil embargo, which sent oil to all-time high and inflation right along with it. There were gasoline shortages in the 1970’s, and oil was up over 30 a barrel. The 1960s and 1970s were in a constant tug-of-war between inflation, recession, economic booms, countermeasures to offset recessions, countermeasures to offset a hot economy, too much optimism, and too much pessimism. My bullish view of inflation had the counterargument that we do not have a baby boom, so this would be unlikely. True, while there is no baby boom causing organic inflation, my view is that the increase in the Fed's balance sheet, called Quantitative Easing (QE), is an artificial baby, causing artificial inflation and offsetting natural deflation. QE is a modern economic countermeasure offsetting disinflation and deflation. Little is understood about QE and how to mathematically quantify its effects. I believe it is like going off the gold standard one more time, which will cause monetary inflation by reducing the dollar's purchasing power.
Oil Embargo
I did not anticipate an “oil embargo” as we had in 1970. The Strait of Hormuz closure is an oil embargo of sorts because oil isn't coming out. It accounts for about 20% of the world’s oil and natural gas, which are needed to run the world's economy. It reinforces my thesis regarding inflation and the echoes of the 1970’s.
“In October 1973, the Organization of Arab Petroleum Exporting Countries(OAPEC) announced that it was implementing a total oil embargo against countries that had supported Israel at any point during the 1973Yom Kippur War, which began after Egypt and Syria launched a large-scale surprise attack in an ultimately unsuccessful attempt to recover the territories that they had lost to Israel during the 1967 Six-Day War. “Wikipedia
The 1973 oil embargo lasted about 5 months and had a significant impact on our economy and stock market. The pain of inflation of this era has lasted in the memories of many Americans. The consequences of this oil embargo can be seen in the following chart:
 Chart: by Jonathan Bever. Data: Bloomberg
The economy went into a recession in 1973, and by the end of 1974, the S&P 500 would fall from about 119.43 on 1/10/1973 to 62.34 on 10/04/1974 or about 47.8%. To recover from this decline, a 91.5% return would be needed just to break even. Today’s similarity in high oil prices due to a supply shock, I will interpret as an intersection. Will we go into a recession? Will the market decline significantly over the next year? It will likely depend on what the Fed does with its monetary policy and the price of oil.
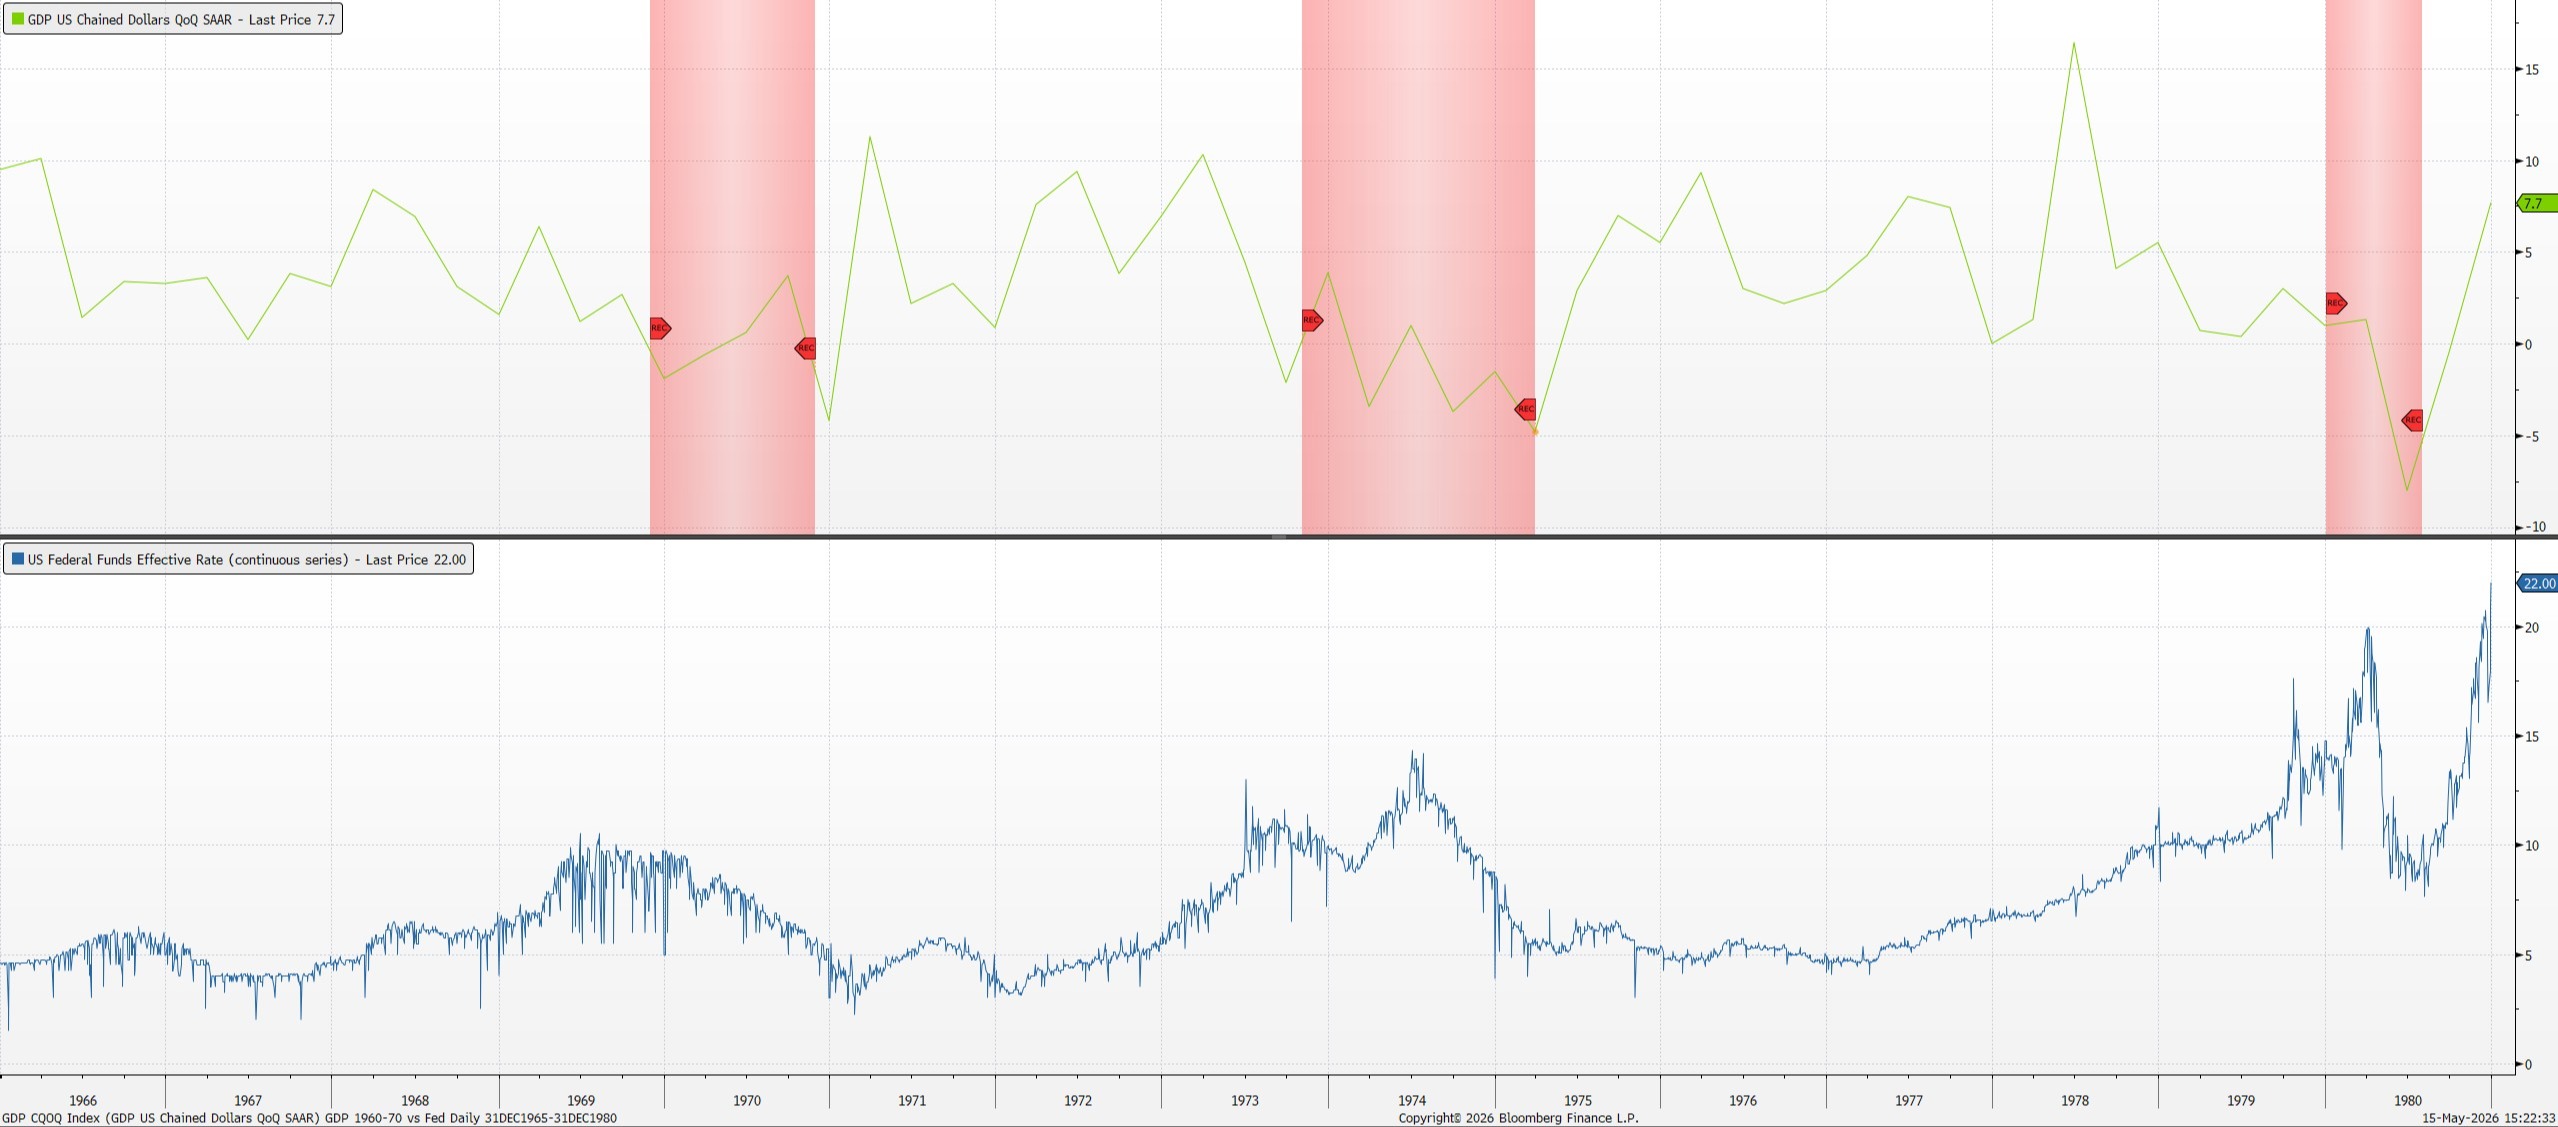
Chart: by Jonathan Bever. Data: Bloomberg
Monetary Policy and Fiscal Policy
Monetary policy is set by our Federal Reserve Bank, such as the Fed rate, and fiscal policy is set by our government, such as income and corporate tax rates. Together, they can stimulate or put the brakes on the economy. Fiscal stimulus: tax cuts put more money into the economy, and monetary stimulus by the Fed, such as lowering interest rates is stimulating the economy. Conversely, increasing income taxes and raising the federal rate slows the economy, as they are restrictive. The most recent policies, such as fiscal measures and the Fed's rate cuts, are likely to lead to higher inflation. Now, the Fed is conducting Quantitative Easing, which increases its balance sheet, stimulates the economy by providing liquidity. This was not a tool that it had in the 1960-1970s. The 1960s-1970s monetary and fiscal policies, which accommodated economic growth, led to excessive inflation and a hot economy. This led to Monetary and Fiscal policy shifting from stimulus to restrictions or putting the brakes on the economy. This led to a recession, and every 5 years we would see the same cycle. Feelings of doom and gloom reigned over optimism, then, with economic shifts, optimism replaced gloom and doom, back and forth every 5 years. This cycle repeated for 20 years, until Fed Chairman Volcker put his foot down to crush inflation. He raised the Fed rate to 20%. Please note, the P/E ratio on the S&P at that time was 8. With the S&P 500 P/E ratio today around 23 and inflation strong, I am cautious; I expect the P/E ratio to decline over the next several years as inflation remains sticky.
The Nixon Shock
Nixon left the gold standard on August 15, 1971. The petrodollar was created (an agreement that oil would be paid for in US dollars), tariffs were imposed (called surcharges on imports), and we had an oil embargo. Further, in 1969, Nixon put pressure on the Fed to ease policy and become less restrictive. All this contributed to inflation, leaving single digits in the 1960’s to double digits in the 1970’s.
“Certainly, recent events share some hallmarks with the 'Nixon shock', which occurred when the then-president took the dollar off the gold standard, implemented a 10 percent import tariff, and introduced temporary price controls. This de-anchoring of the regime resulted in a period of global economic instability and uncertainty. It not only caused a loss in business confidence but also led to stagflation. Nixon’s price and wage controls spectacularly backfired, triggering product shortages and fueling a wage-price spiral. The whole episode was a pivotal contributor to the huge inflation of the ’70s.” Zero Hedge
Interesting to note, in 1972, President Richard Nixon was the first president to visit the People's Republic of China. He and the First Lady Pat Nixon walked on the Great Wall of China as well. (PBS.ORG)
Crude Oil Price Surge
You can see in the following chart the increase in oil prices from under $3.00 a barrel to over $30 a barrel in October 1978. Likewise, CPI went from under 3% to over 10%.
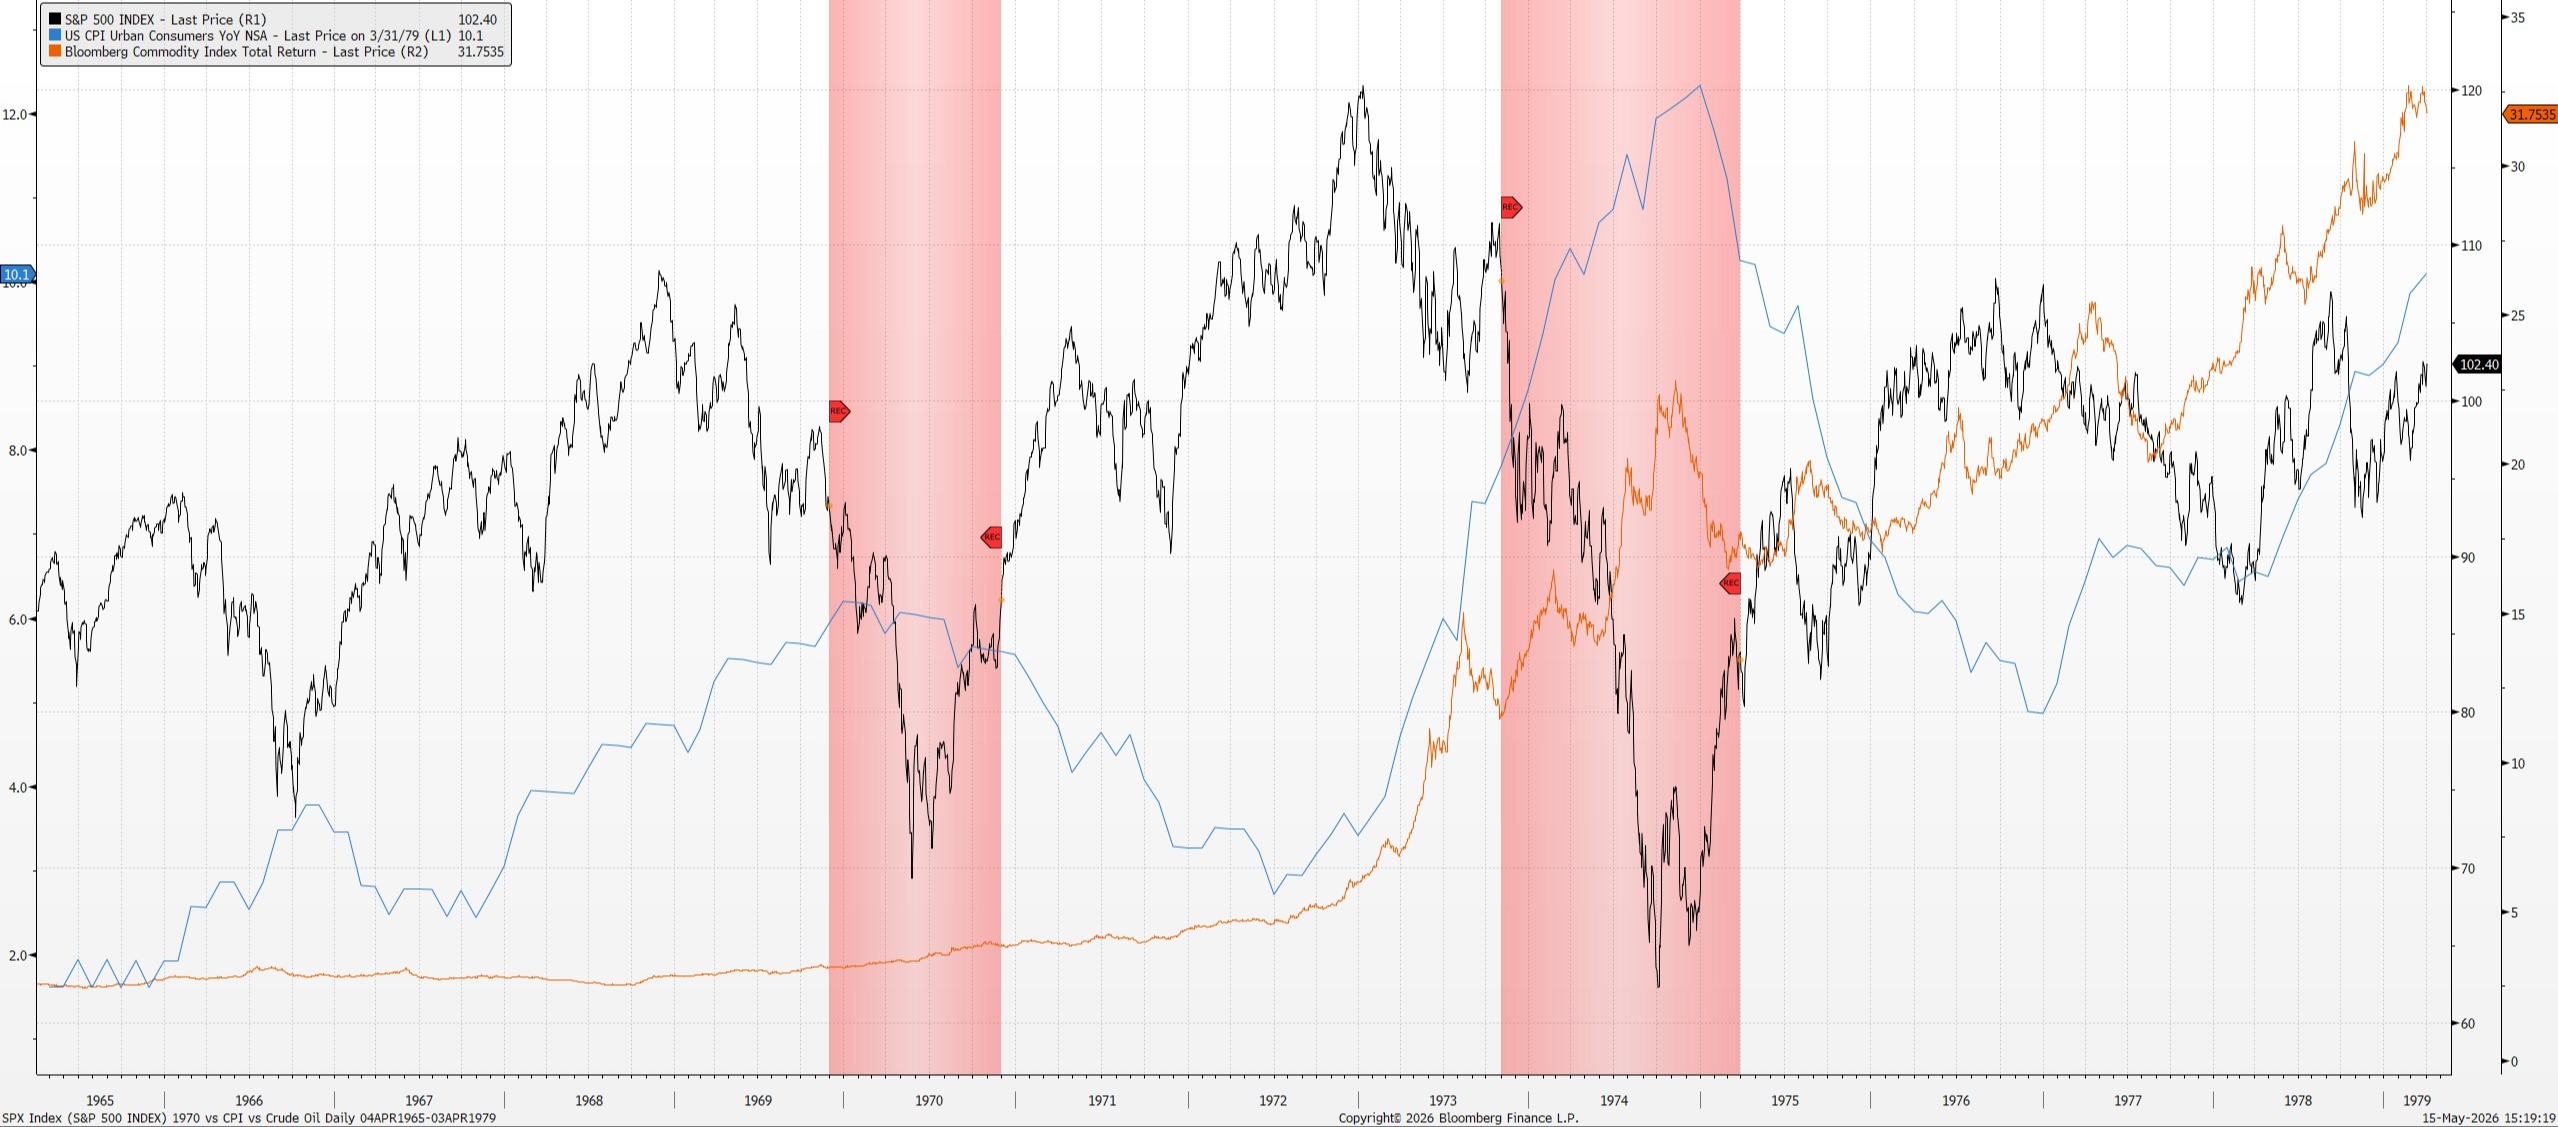
Chart: by Jonathan Bever. Data: Bloomberg
The "Madman Theory"
The "Madman Theory" was a foreign policy strategy used by U.S. President Richard Nixon to make communist leaders in North Vietnam and the Soviet Union believe he was irrational and willing to use nuclear weapons to end the Vietnam War. By acting unpredictably and volatile, Nixon aimed to intimidate adversaries into making concessions, specifically fearing an uncontrollable, "mad" leader with his hand on the nuclear button. Wikipedia.
It is an interesting side note. The USA ended its direct involvement in the Vietnam War on January 27, 1973.
The reason for highlighting these historical quotes and facts is to capture the amount of uncertainty, change, and general lack of confidence the consumer faced. I think today we can relate, and I will reiterate, “we have been here before.”
Consumer Confidence
Let’s look at the University of Michigan Consumer Sentiment. It is currently at its lowest level since inception. It is even lower than the 2008/2009 financial crisis. A contrarian may find this to be good news. Nonetheless, it is an ear mark of where we are.
 Chart: by Jonathan Bever. Data: Bloomberg
Gold
Gold prices peaked with an average price of 666.75 per ounce on 9/30/1980. In the 1960’s, gold was pegged at 35.13 an ounce. In 1971, when we left the gold standard, gold prices were no longer pegged at 35 an ounce. Gold is the gold line in the chart below:
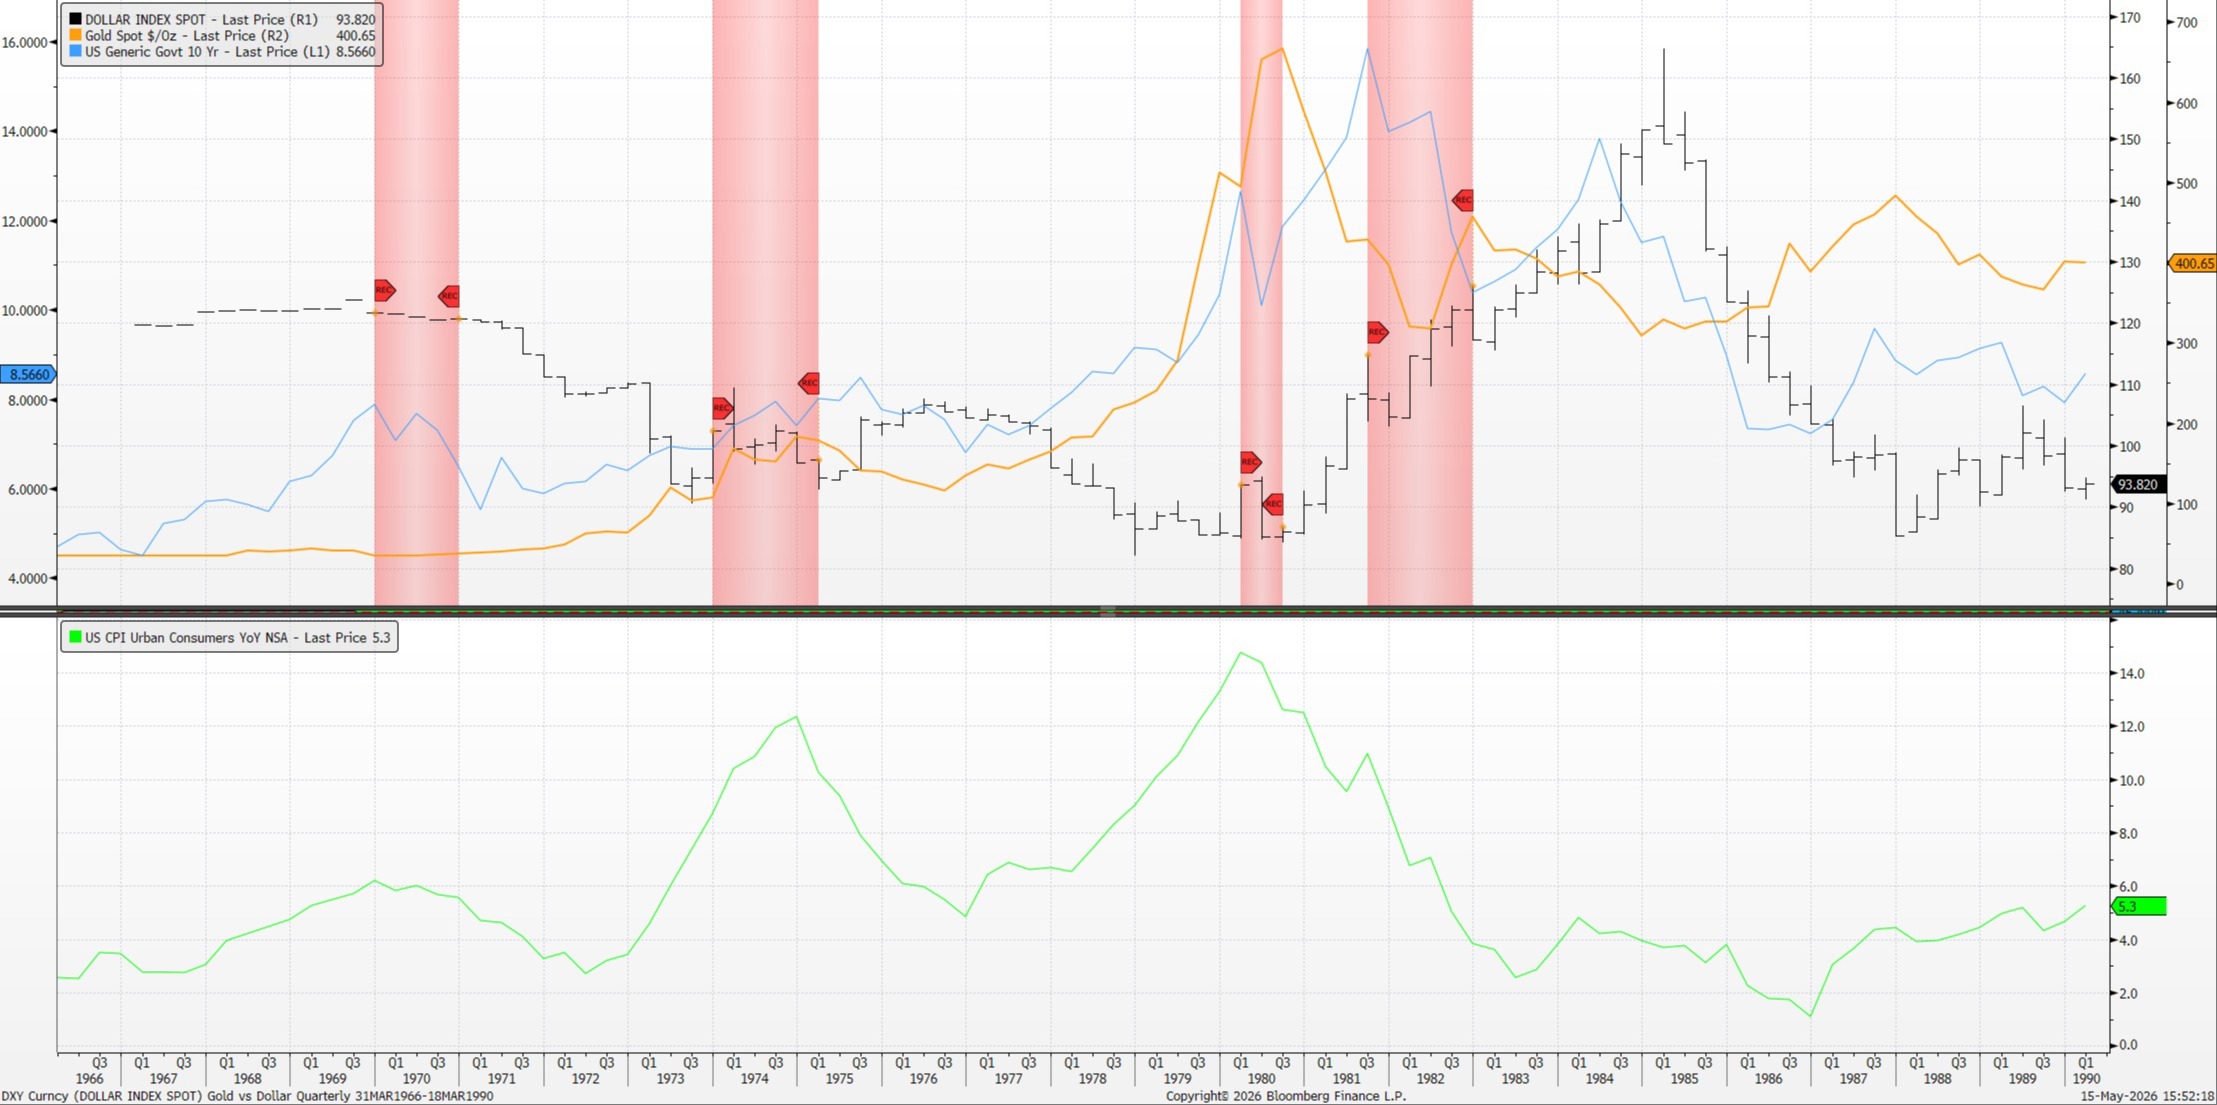
Chart: by Jonathan Bever. Data: Bloomberg
The performance of gold: 35 to 666 is about an 1800% increase. Recently, gold has gone from $1061 on 12/31/2015 to over 5,000 an ounce on 01/26/2026. Will gold continue its price run to compete with its performance in the 1970’s? Be prepared for the possibility. It is worth noting that gold prices fell by more than half to under 300 not long after the Fed chair, Paul Volcker, raised the Fed rate to 20% in 1980.
One Ounce of Gold buys a Man’s Suit
A good suit for a man is seen as having a store of value because of its craftmanship, materials, and it will likely last for years. An ounce of gold is also seen as a store of value because it lasts forever. Over time, there has been a ratio between the cost of an ounce of gold and the average cost of a well-made man’s suit. One ounce of gold buys a good suit. Assuming this relationship holds, either the price of a man’s suit will rise to about $5000, or gold will fall in price.
If the average price of a man’s suit is $5000, then this could be a harbinger of significant inflation ahead.
Gold/Crude Oil Ratio
There is a similar ratio regarding how many barrels of crude oil one ounce of gold can buy.
The gold/WTI (West Texas Intermediate) ratio expresses the price relationship between gold and WTI crude oil. The chart shows the quantity of barrels of WTI Crude Oil in US dollars that one ounce of gold can buy since 1974. A high ratio indicates that gold is relatively expensive relative to WTI crude oil, and oil is relatively inexpensive relative to gold.
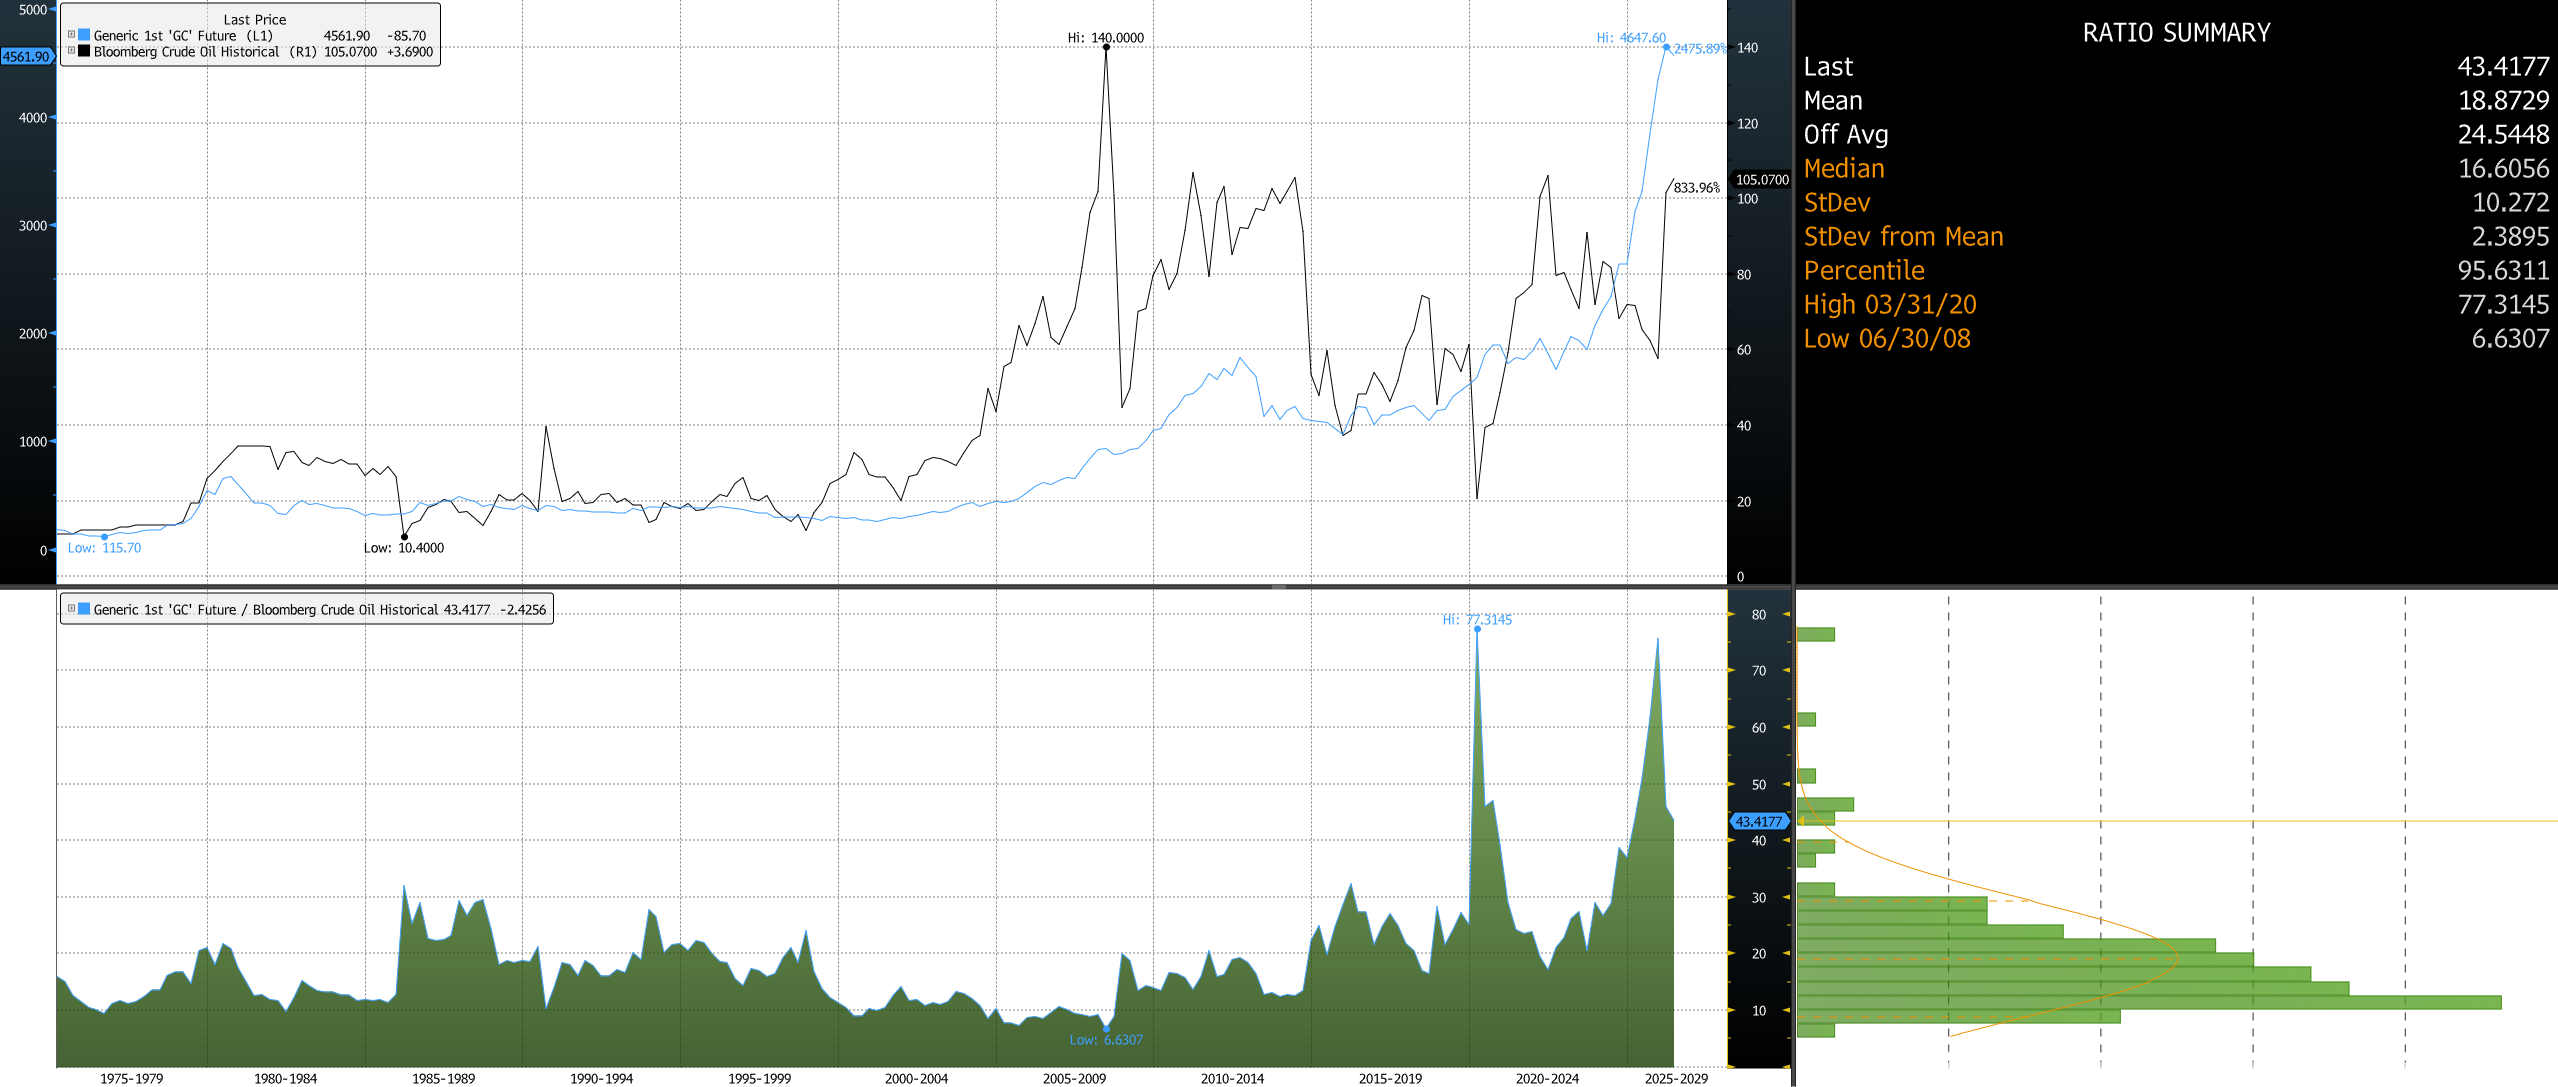
Chart: by Jonathan Bever. Data: Bloomberg
The Mean is 18.75. However, today the ratio is 45.8434. Therefore, I believe that either crude oil prices will rise, gold will fall, or both will rise. Why this is so important is its relationship with inflation. High oil prices lead to inflation across almost everything for various reasons, such as higher gas and diesel prices, which raise transportation costs. Gold on its own seems to be a barometer of inflation.
Great Financial Crisis and QE (Quantitative Easing)
Let us go back to 2008/2009, when the US had a Great Financial Crisis. Many financial companies needed a bailout because their balance sheets left them undercapitalized due to declining asset values. The S&P 500 went from the 2007 peak of around 1565.15 on 10-09-2007 to an intraday low of 666.79 on March 6, 2009. The price drop was 898.36 or about 57%. The wealth destruction was horrific.
“The S&P 500 hit its lowest point of the 2009 financial crisis on March 9, 2009, with a closing low of 676.53. Earlier that week, on March 6, 2009, the index dropped to an intraday low of 666.79, marking the bottom of the bear market that accompanied the Great Recession. Wikipedia
There was a massive bank bailout. Part of the recovery package led to an increase in the Federal Reserve balance sheet. This was called quantitative easing (QE).
2020 Pandemic
Further, let us move forward to 2020, we had a pandemic, and the economy was collapsing. Extreme economic measures were necessary to stimulate the economy and repair the economic destruction caused by the pandemic. Again, QE was used aggressively, along with the Fed lowering its rate to near zero. This led to an overheated economy, as measured by both GDP and CPI. This created an inflationary gap due to all the stimulus and the resulting optimism. A couple of years later, in 2022, Russia went into Ukraine, and crude prices spiked. I have argued that one of QE's Achilles' heels is high oil prices. At the same time, the administration had to address an overheated economy and high inflation. What followed would be exactly what you might expect. To slow down inflation and the economy, the exact countermeasures had to be implemented. If a low Fed rate, a ballooned Fed balance sheet by the tune of trillions, and lots of economic optimism led to an overheated economy, then optimism had to be quenched, the Fed rate would have to go up aggressively, and the QE would have to be reduced (called quantitative tightening or QT. Stock market volatility ensued, and optimism, as measured by the University of Michigan consumer sentiment index, plummeted. Negativity was exacerbated in 2023, and five banks failed.
Five banks collapsed in the U.S. in 2023. While low in number, these failures were significant in size, including major institutions like Silicon Valley Bank and Signature Bank in March, followed by First Republic Bank in May, and smaller banks Heartland Tri-State Bank and Citizens Bank in July and November, respectively. “Federal Deposit Insurance Corporation.
What was the cause? The Fed's rate hikes and rising Treasury yields reduced the value of banks' balance sheets, causing liquidity issues, and now banks were failing once again. So, the Fed pivoted from being a Hawk (wanting to fight inflation) to being a Dove (more concerned with lowering rates to stimulate the economy to avoid deflation or disinflation). When interest rates go up, bond values go down, and banks own a lot of bonds. The longer a bond's maturity, the lower its price. Likewise, if rates go down, they can appreciate. We are in a paradigm shift regarding the long-term trend in interest rates. Our interest rates have gone down for over 40 years. I believe interest rates will generally trend higher over time, and the lows we have seen will be firmly in the rear-view mirror.
Treasury Yields
(Interest Rates Paradigm Shift)
As you can see from the chart below, 10-year Treasury yields have declined from 1980 to 2020. The black line is the 10-year Treasury yield, and the red line is the US Dollar.
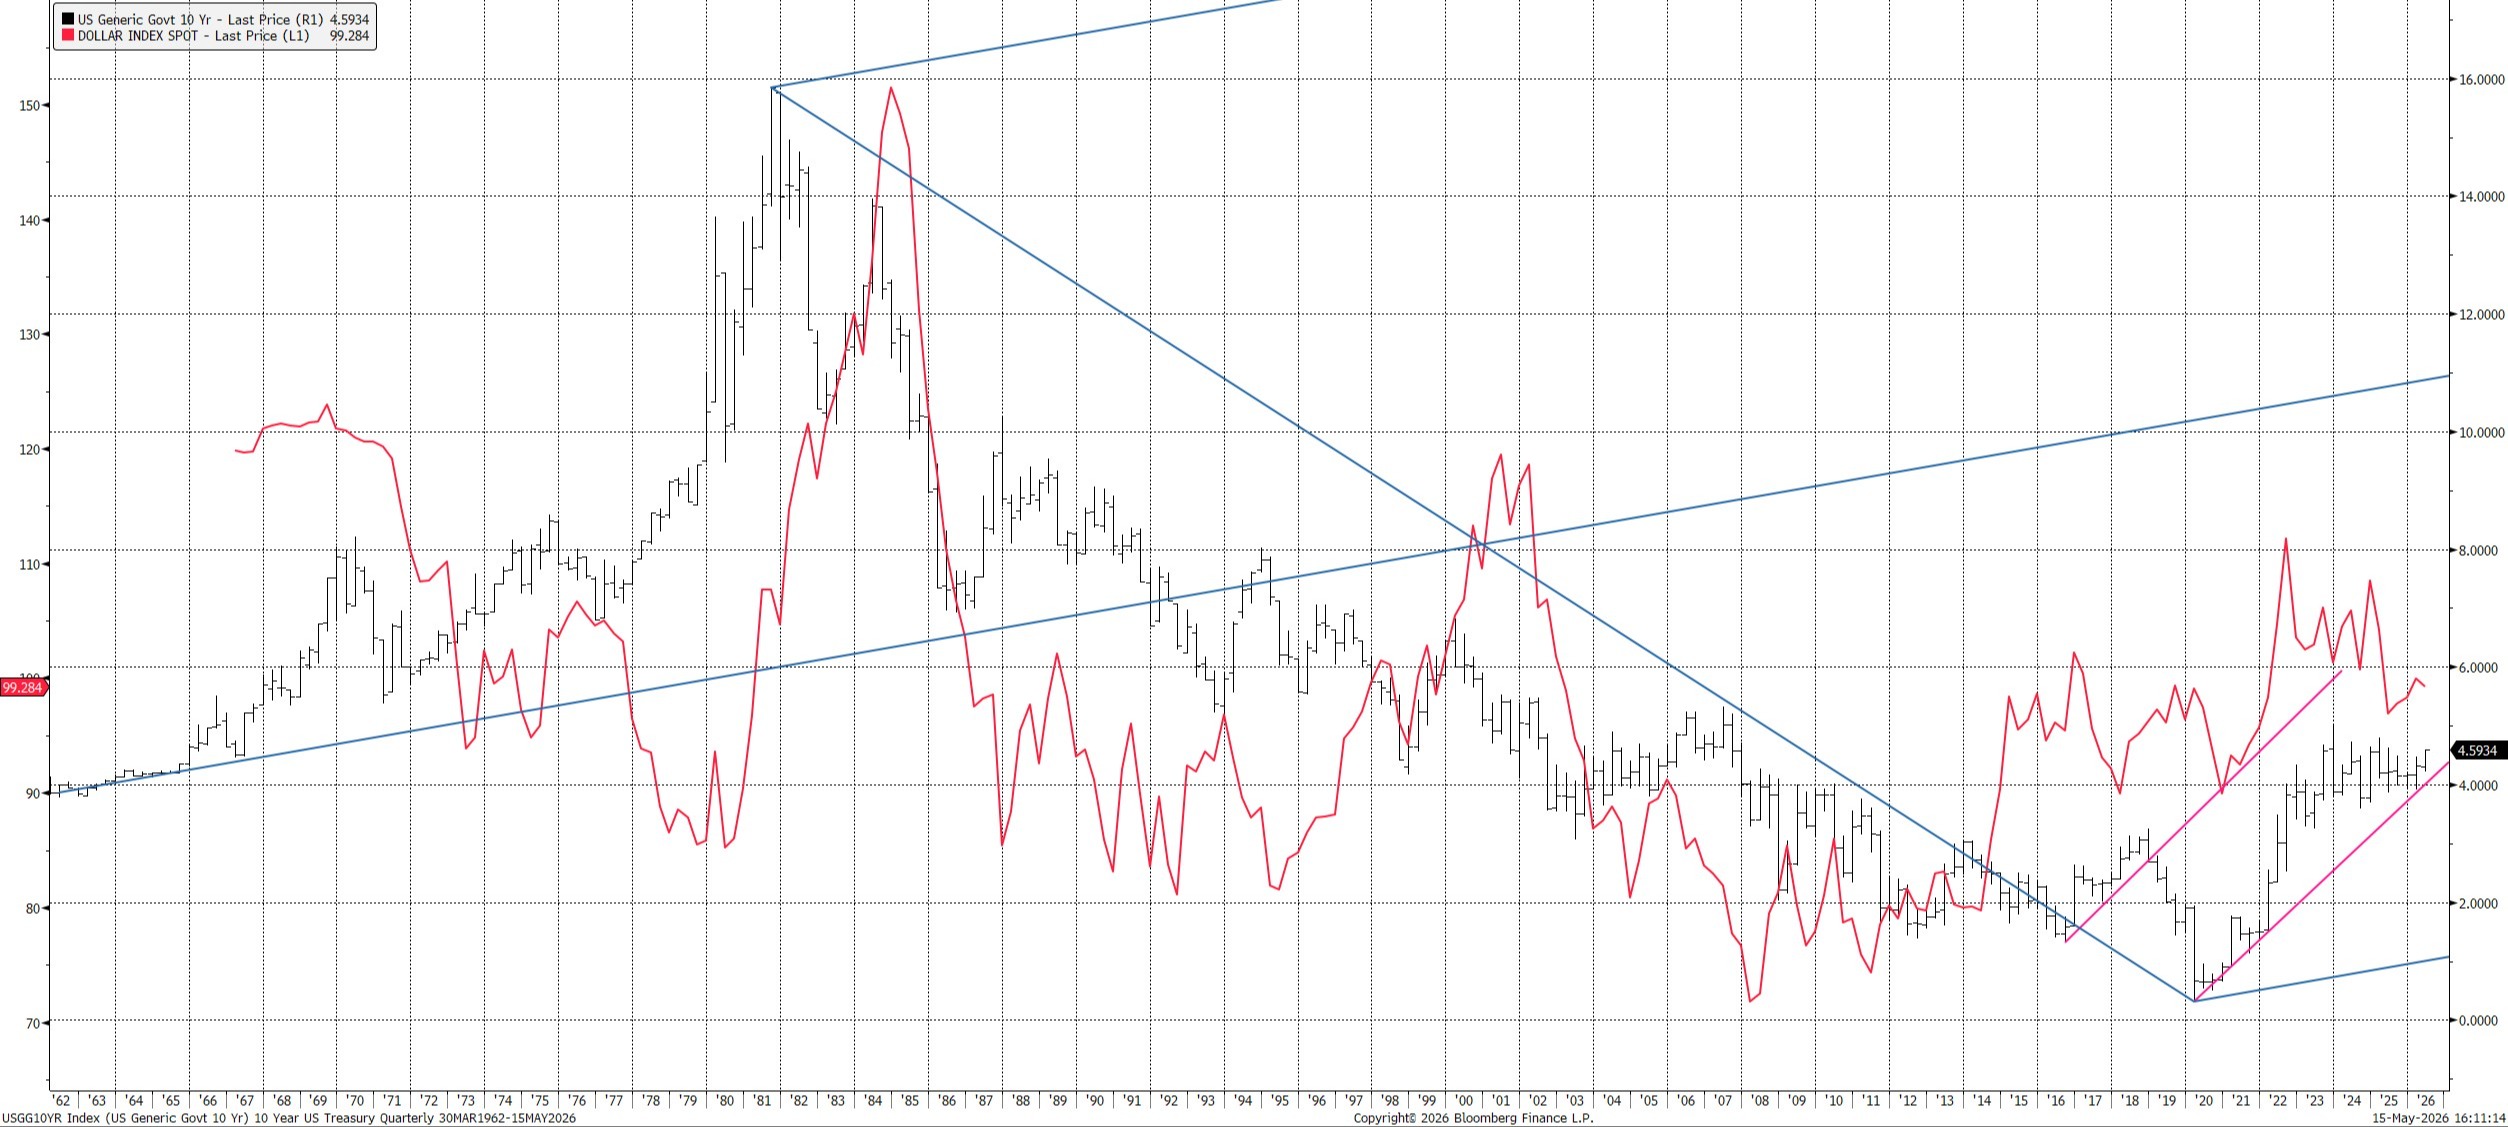
Chart: by Jonathan Bever. Data: Bloomberg
For over 40 years, the yield has declined, and only recently started trending higher. Likewise, you can see the dollar decline as well over the same period. The 10-year Treasury yield began rising in 2020, and so did our dollar. Will the 10-year Treasury yield continue to cycle higher, and will the dollar rise with it? Will there be a divergence, or will they move in tandem?
The US ten-year Treasury yield went from 15.82% down to 0.3137%. Currently, the yield is about 4.22%. Bond yield trends move slowly and last for years. I believe interest rates will trend higher for several years. The Fed raised the rate to 20% in 1980. A 33.3% Fibonacci retracement takes the yield to 6.66%. If our 10-year Treasury moves up with the Fed rate, I can see the same yield on the 10-year Treasury.
Don’t Let Your Fixed Income Investments Get Hammered
When interest rates rise, bond prices fall. An investor's fixed income allocation is supposed to be the safer part of one’s investment portfolio. With fixed-income yields so low, investors have sought higher-yielding investments. I have heard many people refer to some investments as “fixed income alternatives.” These alternatives range from private credit, annuities, structured notes, and floating rate securities to name a few. Fixed income has been defined by the CFA Institute:
“Fixed income is defined as debt securities where investors loan money for a scheduled, fixed repayment of principal and interest. It includes bonds, notes, and money market instruments.” CFA Institute.
CFA Asset Allocation Curriculum warns about generalizations regarding “fixed income.”
“For example, if a manager lumps together very different investments, such as distressed credit and Treasury securities, into an asset class called “fixed income,” asset allocation becomes less effective in diversifying and controlling risk.” CFA Institute, Asset Allocation Volume 1.
Fixed income has traditionally had the primary objective of returning your principal at a stated maturity. There are two main concerns regarding these alternatives: liquidity and the potential loss of principal. Again, don’t let the safer portion of your asset allocation get hammered. I recommend understanding your fixed income investments; keep the time to maturity short, investment grade, and liquid. If I am right, then the increasing yields will lead to higher borrowing costs and a headwind to the performance of some risk assets. Stick to the adage: focus on the return of principle rather than the return on the principle. If you want a review of your fixed-income allocation, please call to schedule an appointment.
Tariff Shock
It is easy to forget that, not long after, the Fed implemented aggressive rate hikes in 2022 to address high CPI inflation. Again, when interest rates rise, bond prices fall. Several banks had issues with their balance sheets as their assets went down in value.
If you want to slow down inflation and the economy, and you don’t want to use fiscal policy by raising tax rates (in fact, you want to cut tax rates), and if the Fed doesn’t want to use its monetary policy to raise rates (the last time they did, several banks did not survive), then what do you do? Are you thinking of tariffs? If so, I would say you are correct. Tariffs have several consequences, and for my purposes, we will focus on inflation.
1. The cure for high prices is high prices. Tariffs raise the final cost of an item; it will slow consumption, and as demand wanes, so do prices. Disinflationary
2. Who pays the tariff? Either the importing cost is passed on to the consumer, or the consumer pays. It is a tax without calling it a tax.
3. Who gets the revenue? The governments of importing countries receive the revenues.
4. In short, the tariffs are doing some heavy lifting for the Fed and government.
The psychology of tariff rhetoric is equally important. It slows consumer enthusiasm, which may lead to less spending; hence, lower demand and, in time, possibly lower prices.
My forecasts are rooted in the belief that inflation is real and will keep rising. The market has a price-to-earnings (P/E) ratio of 23, and on a longer-term historical ratio, the P/E ratio is about 16. Further, historically, there is a relationship between interest rates and the P/E ratio. The higher the 10-year treasury yield, the lower the P/E. For example, when the Fed rate was 20 in 1980, the P/E ratio on the S&P 500 was 8. Therefore, I argue that, going forward, there will be a headwind to the expansion of the PE ratio, and ultimately it will compress towards its historical average. Lower rates make it easier to make money. Just like walking downhill. Conversely, rising rates can make it more difficult to make money, like walking uphill.
Mar-a- Lago Accord vs The Plaza Accord
In the 1980’s, we had the Plaza Accord, which was intended to weaken the US Dollar primarily against the Japanese Yen. I wrote about this in my last Japan blog. The result weakened the dollar and strengthened the yen. The strong yen popped the Japanese miracle economy, and the Nikkei 225 fell for over 20 years. Today, there is talk about weakening the dollar called: “The Mar-a-Lago Accord.”
“The 'Mar-a-Lago Accord' is a speculative, proposed economic strategy—inspired by the 1985 Plaza Accord—aimed at weakening the US dollar to boost American manufacturing, exports, and rebalance trade. It suggests forcing allies to accept a weaker dollar, using tariffs to drive investment, and restructuring foreign-held US Treasury debt.” Council on Foreign Relations.
The Plaza Accord
The Plaza Accord took place when the Yen was very attractively priced compared to the dollar, and Japan had the second-largest economy in the world. Our dollar was very strong for several reasons. One reason was the yield on our 10-year Treasury. At this time, it was about 9.65%. A few years earlier, it was over 15%. I believe there are headwinds to a strategy that makes our dollar weaker this time around. One example is our 10-year Treasury yield. Please see the chart below. This chart shows the correlation between our dollar and the 10-year Treasury yield. I believe our ten-year yield will trend higher over the long term. Yields could temporarily decline if we enter a recession.
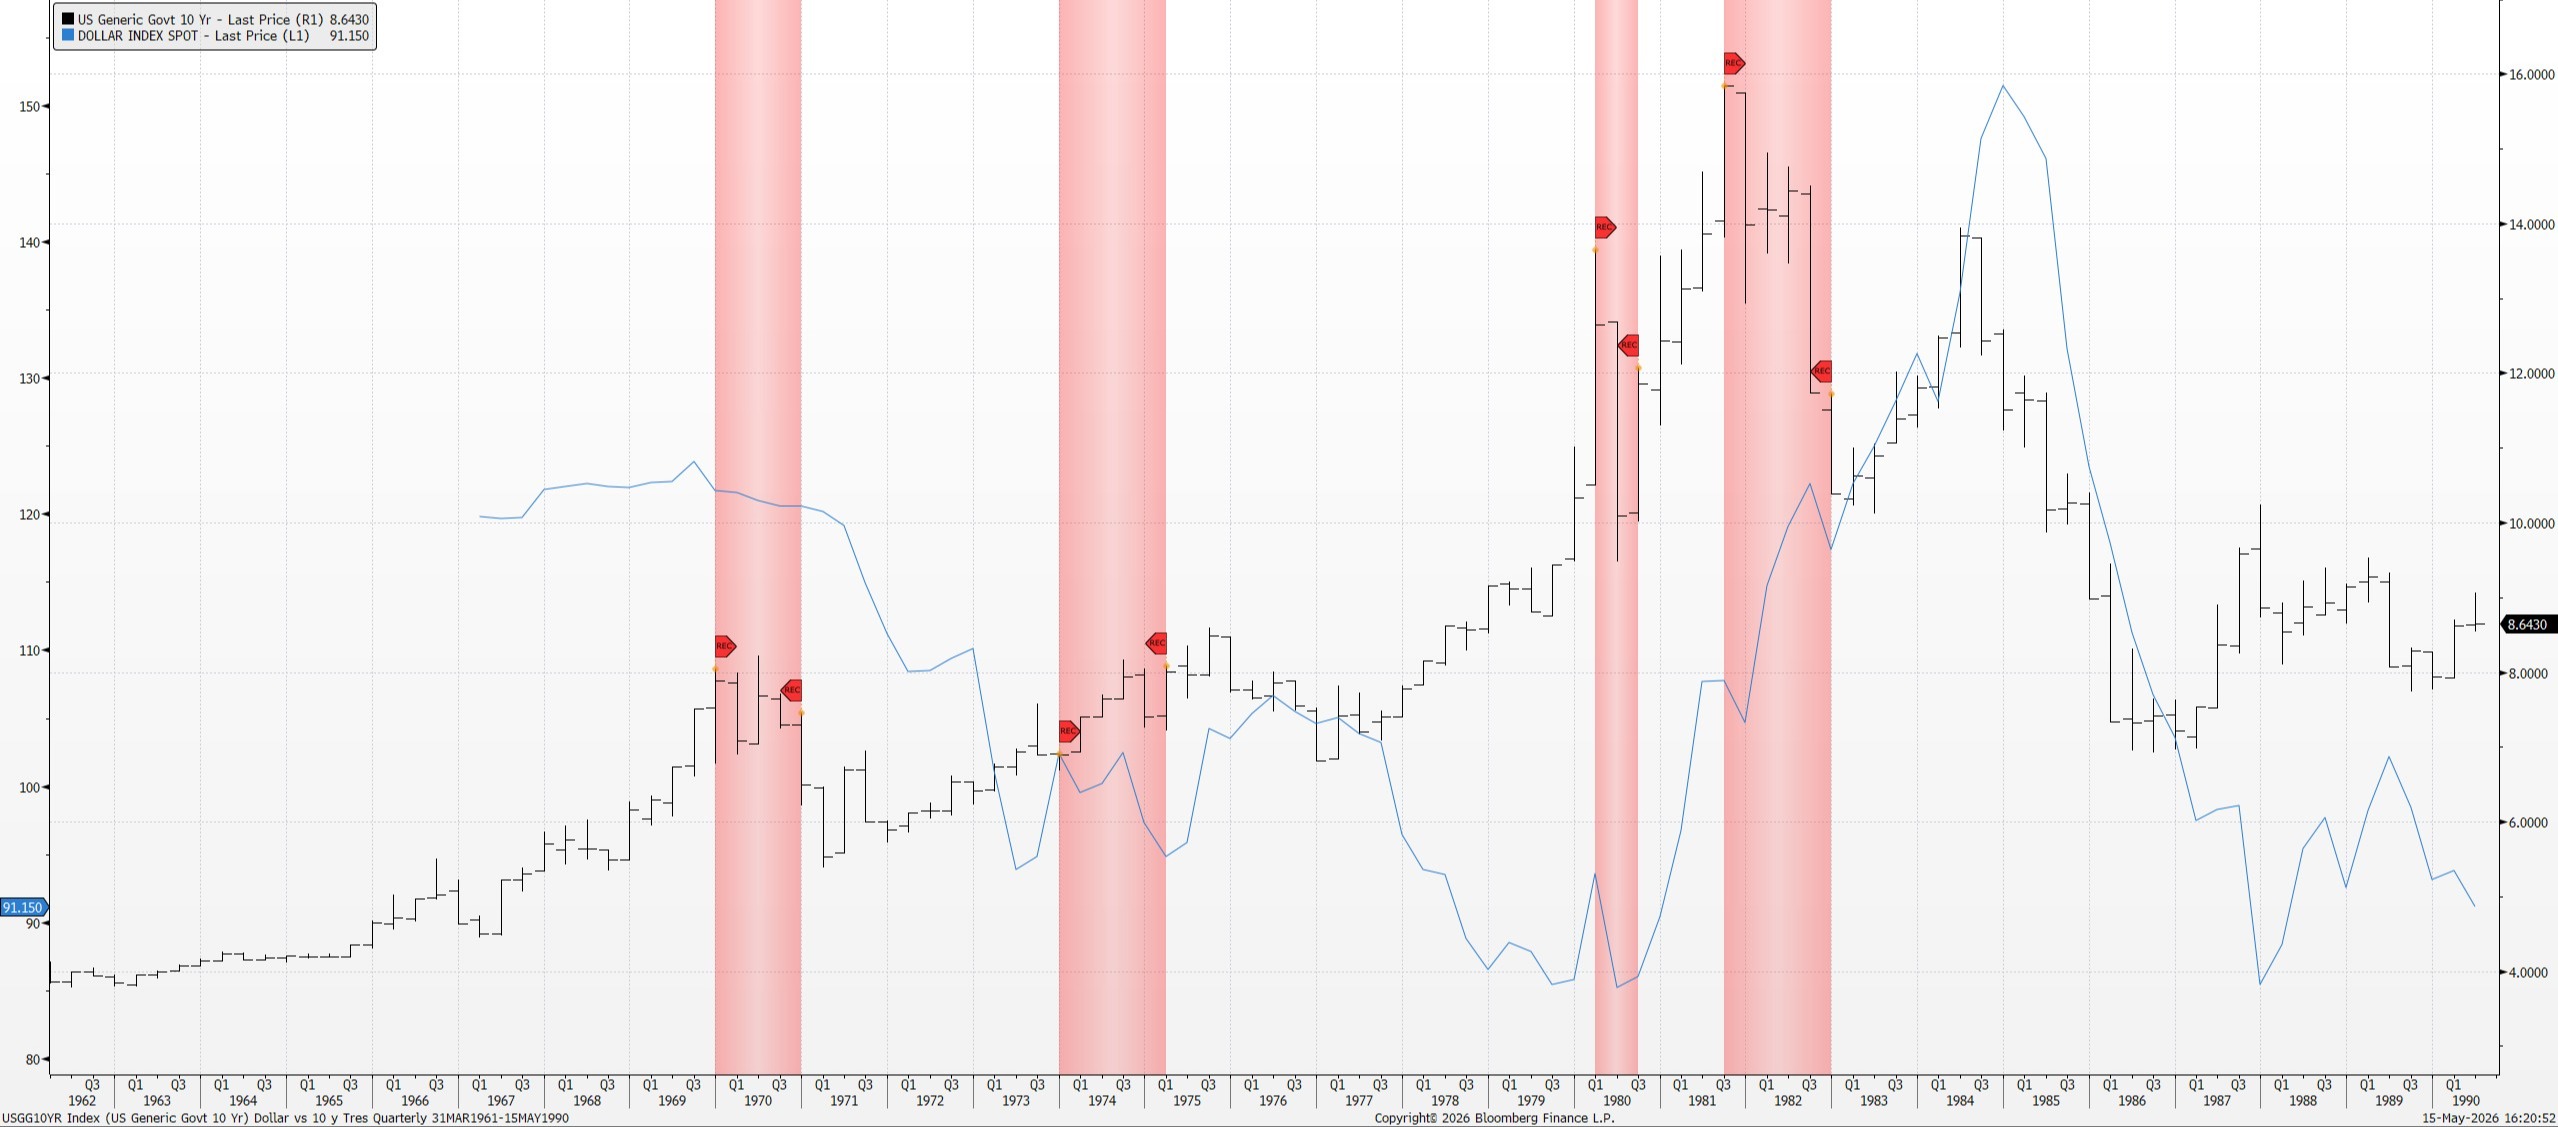
Chart: by Jonathan Bever. Data: Bloomberg
Maximum Confusion
How do you know when you reach maximum confusion? It is when you are overwhelmed by all the news and find yourself numb; that’s when you know you have reached the point of maximum confusion. Just remember, we have been here before.
Summary
Successful investing in different time periods has different attributes. Currently, we are at various intersections. Is this a return to the 1960s-1970s with all the cycles and inflation, or is it a head fake? If inflation comes down due to technological advances, such as artificial intelligence and robots, it could reduce labor inflation. Will an increase in oil supplies bring down oil inflation? If deflationary pressures come from both labor costs and energy, then it may not be a return to that era, and the S&P 500 bull market should continue. If, however, we are back in the 1960-1970s era and inflation reaches double digits, the stock market will face a significant headwind, and investor returns should be modest compared to the returns of the last 30 years.
Strategies for Investment Planning in 2026
1. Diversify for Inflation Protection
2. Prioritize Quality Investments
3. Adjust Fixed Income Allocations
4. Stay Flexible
Footnotes:
In 1969 and early 1970, President Richard Nixon and his administration pressured the Federal Reserve to loosen monetary policy, arguing that strict anti-inflation measures were too restrictive and risked a recession. Nixon aimed for a high-growth economy for political reasons, pressuring Fed Chair Arthur Burns to increase the money supply, setting the stage for 1970s stagflation. Federal Reserve Bank of Minneapolis.
France, under President Charles de Gaulle, ramped up demands for gold repatriation in the mid-1960s, culminating in 1971 when it sent a battleship to collect their gold. Facing this run on the dollar, President Nixon announced on August 15, 1971, that the US would stop converting dollars into gold, officially ending the Bretton Woods System.
“France has sold its remaining gold holdings that were held in the U.S. Federal Reserve, completing a long-term plan to bring its gold reserves home and update its old stock to meet modern international standards. The country’s central bank, the Banque de France, made nearly 13 billion euros, or around $15 billion, after upgrading 129 tonnes of gold between July 2025 and January 2026 and replacing it with new, compliant bars stored in Paris.” Newsweek
DISCLOSURES:
CPI
The Consumer Price Index (CPI) measures the monthly change in prices paid by U.S. consumers. The Bureau of Laor Statistics the CPI as a weighted average of prices for a basket of goods and services representative of aggregate U.S. consumer spending.
The prime rate
The prime rate is the interest rate that commercial banks charge their most creditworthy customers. The Federal Reserve System sets the federal funds overnight rate, which serves as the basis for the prime rate, which in turn serves as the starting point for other interest rates.
The prime rate, which is sometimes simply referred to as prime, is the most commonly used benchmark used by banks and other lenders when setting their interest rates for various products, such as credit cards and home loans.
Yield Curve:
A yield curve is a line that plots yields, or interest rates, of bonds that have equal credit quality but differing maturity dates. The slope of the yield curve can predict future interest rate changes and economic activity.
There are three main yield curve shapes: normal upward-sloping curve, inverted downward-sloping curve, and flat.
The prime rate is the interest rate that commercial banks charge their most creditworthy customers. The Federal Reserve System sets the federal funds overnight rate, which serves as the basis for the prime rate, which in turn serves as the starting point for other interest rates. 1 Investopedia.
Central bank balance sheet:
The central bank balance sheet is one of the central bank's reporting formats that reflects the state of its allocated, borrowed, and owned funds as of a certain date.
The central banks of most countries in the world calculate and publish balance sheet data on a monthly basis (for example, in Austria, Japan, Poland, Russia, Luxembourg, the Netherland, and Mongolia. In a number of countries, the central bank balance sheet is published quarterly (for example, in Estonia,) and weekly (in Australia, Eurozone, UK and the USA).
Today, the balance sheet is actively used by central banks in their monetary policy, in particular, in the formation of its transmission mechanism.
The Central bank’s balance sheet consists of two parts: assets and liabilities. The table below shows the classic structure of a country’s central bank balance sheet. Bonds Glossary.
Quantitative Monetary Easing
Bloomberg:
As of 1/29/2016, BOJ employed "Quantitative and Qualitative Monetary Easing with a Negative Interest Rate" on their monetary policy. Please read the following link for further information http://www.boj.or.jp/en/announcements/release_2016/k160129a.pdf As of 04/04/2013, the BOJ has shifted its monetary policy focus to a targeted monetary base via Japanese government bond (JGB) purchases. Pls refer to: http://www.boj.or.jp/en/announcements/release_2013/k130404a.pdf (English). As a result, there will be no prices updated after April 4, 2013. For monetary base outcome, please refer to ALLX BOJT<GO>. For the Actual result of the Overnight call rate, please see MUTKCALM Index DES<GO>.
Plaza Accord
The Plaza Accord was a joint–agreement signed on September 22, 1985, at the Plaza Hotel in New York City, between France, West German, Japan, the United Kingdom, and the United States, to depreciate the U.S. dollar in relation to the French franc, the German Deutsche Mark, the Japanese yen and the British Pound Sterling by intervening in currency markets. The U.S. dollar depreciated significantly from the time of the agreement until it was replaced by the Louve Accord in 1987. Some commentators believe the Plaza Accord contributed to the Japanese asset price bubble of the late 1980s. Wikipedia
S&P 500 Index
S&P 500-A capitalization-weighted index of 500 stocks designed to measure performance of the broad domestic economy through changes in the aggregate market value of 500 stocks representing all major industries.
Investors cannot invest directly in indexes. The performance of any index is not indicative of the performance of any investment and does not take into account the effects of inflation and the fees and expenses associated with investing.
GDP CURY INDEX: Gross Domestic Product (GDP) is the monetary value of all finished goods and services made within a country during a specific period. GDP provides an economic snapshot of a country, used to estimate the size of an economy and growth rate. GDP can be calculated in three ways, using expenditures, production, or incomes. Apr 29, 2020 Investopedia
GDP at purchaser's prices is the sum of gross value added by all resident producers in the economy plus any product taxes and minus any subsidies not included in the value of the products. It is calculated without making deductions for depreciation of fabricated assets or for depletion and degradation of natural resources. Data are in current U.S. dollars. Dollar figures for GDP are converted from domestic currencies using single year official exchange rates. For a few countries where the official exchange rate does not reflect the rate effectively applied to actual foreign exchange transactions, an alternative conversion factor is used. World Bank national accounts data, and OECD National Accounts data files. Data is updated with a 1-2 year lag due to the large amount of data processed by the World Bank. Yearly data is therefore available around September of the current year for the previous year. Bloomberg.
Quantitative easing(QE) is a monetary policy whereby a central bank buys government bonds or other financial assets in order to inject money into the economy to expand economic activity. Wikipedia
The Fed Balance Sheet
FEDL01 Index:
Until March 1, 2016, the daily effective federal funds rate was calculated by the New York Fed as a volume-weighted mean of overnight rates on trades arranged by major brokers. As of March 1, 2016, the New York Fed is reporting the daily volume-weighted median value of trades provided by the brokers. All rates are subject to revision by the New York Fed. Bloomberg
FEDL01: is a spliced series of the mean-based calculated values of the effective rate (prior to March 1, 2016) and the median-based calculated values of the effective rate (from March 1, 2016).
4.1 report: which provides a consolidated statement of the condition of all Federal Reserve banks, in terms of their assets and liabilities. ... It lists all assets and liabilities, providing a consolidated statement of the condition of all 12 regional Federal Reserve Bank. May 11, 2020 Investopedia
In the United States, the federal funds rate is the interest rate at which depository institutions lend reserve balances to other depository institutions overnight on an uncollateralized basis. Reserve balances are amounts held at the Federal Reserve to maintain depository institutions' reserve requirements. Wikipedia
Securities offered through Cetera Wealth Services, LLC member FINRA/SIPC. Advisory Services offered through Cetera Investment Advisers, LLC, a registered investment advisers. Cetera is under separate ownership from any other named entity. Bellevue Wealth Advisors is not a broker/dealer and/or an investment adviser.
The views stated in this letter are not necessarily the opinion of Cetera Wealth Services, LLC member FINRA/SIPC, and should not be construed directly or indirectly as an offer to buy or sell any securities mentioned herein. Due to volatility within the markets mentioned, opinions are subject to change with or without notice. Information is based on sources believed to be reliable; however, their accuracy or completeness cannot be guaranteed. Past performance does not guarantee future results. Investors cannot invest directly in indexes. The performance of any index is not indicative of the performance of any investment and does not consider the effects of inflation and the fees and expenses associated with investing.
All charts courtesy of Bloomberg Finance L.P.
Bellevue Wealth Advisors, LLC, 10655 NE 4th Street, STE 622 NE Bellevue, WA 98004
425-233-2922